As mentioned before, accuracy is a metric that must be used with a lot of caution as it can be misleading if used solely. This metric is most useful when we are working with balanced datasets.
3. Recall vs Precision:
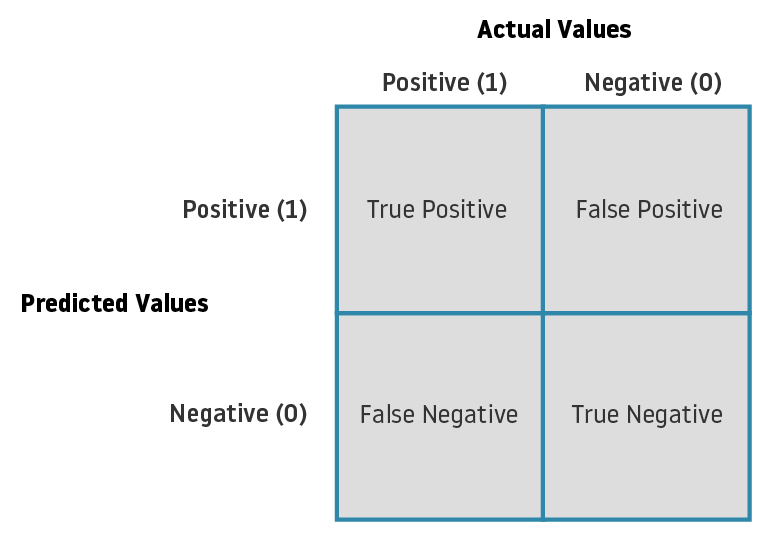
Precision can be seen as a metric that gives us information of how well our model performs with regard to the False Positives. Recall, similar to precision, gives information about the performance with regards the False Negatives. In our case scenario, we are more interested in minimising False Negatives (passengers overbooked) so we are looking for as big of a Recall as possible without overlooking Precision. If our model predicts all passengers as positive (1) events, our Recall would be 100%. But what could occurs is that our flights, due to no-shows, have a load factor inferior to the Break-even load factor which is bad for the revenue.
4. Specificity:
The use of the Harmonic mean, in contrast to the arithmetic mean, makes the F1 score metric more sensible to the differences between Recall and Precision, making it lean closer to the smaller of both numbers. Some of the main concerns raised in using this metric are that it gives the same relevance to Precision and Recall (False Positives and False Negatives). In reality, as mentioned before, there can be different costs for the possible misclassifications (overbooking vs Empty seats).
6. AUC-ROC Curve:
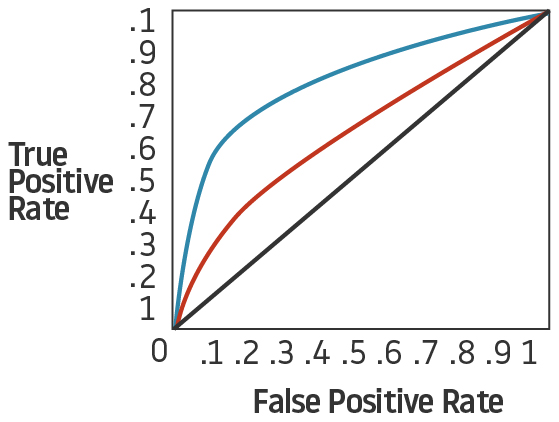
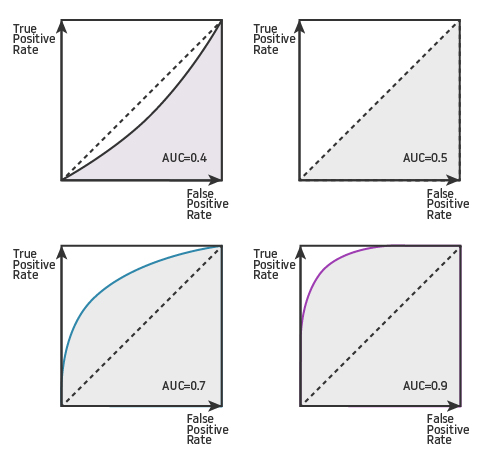
AUC (Area Under Curve) is almost certainly the most used metric for the evaluation of binary classification models. ROC ( Receiver Operating characteristic Curve) is the most common way of visualizing how well a classifier works.
MAE is simply the average of the difference (as an absolute) between the predicted values and the actual data (see the formula below). The main characteristics of this metric are that as it uses the absolute and does not take in account the direction of the error (the metric does not depend on the real ROT being faster or slower than the predicted) and that all individual errors are weighted equally in the average (all errors have the same importance).
2. RMSE:
There is a lot of debate whether to use MAE or RMSE when evaluating a model. Both metrics are indifferent to the direction of errors and the lower the values of the error, the better the model. The main difference between both metrics is how they respond to large error. Let’s use an example of the case study proposed. We have 5 aircrafts that have landed in our airport with the next ROT [40, 51, 57, 43, 61] and our models give these corresponding predictions [45, 48, 64, 47, 57]. The errors for our model would be: MAE = 4.8 and RSME = 5.1. Choosing one over the other comes again to a business decision and the cost associated to the errors. If the cost of the error does not increase considerably with the value of the error then MAE could be more appropriate, but if the cost associated with a large error is big, then it maybe better to use RMSE to evaluate your model. In our case study, predicting an ROT that is considerably higher than the real one would have the cost of underusing the runway capacity. On the other hand, a considerable lower ROT prediction could cause a safety incident, which is a really high cost for the airport. So in our model it seems wise to more severely penalize the big errors. In that case, RMSE would be more appropriate to use.
I hope this blog has helped you better understand the main metrics available to evaluate Machine Learning models as well as raised awareness of the advantages and disadvantages of each. In the end, each metric provides you with a specific picture of the performance of your model. You are the one that has to decide which metric (or metrics) best helps you ensure your model is working the way you desire. At least now you will be skeptical the next time someone presents a model with 99% Accuracy. Do not forget to visit other fantastic blogs in datascience.aero to learn and discover new things about the wonderful world of Data Science and Aviation.


