COVID-19 side effects: How has decreasing Air Traffic volume affected the accuracy of Weather Forecasts?
The COVID-19 pandemic will change our lives forever, not only through how we interact with each other everyday, but also through the huge socio-economical impact it will have on countries and industries. Aviation has been one of the biggest sectors affected by this misfortune. Many airlines and manufacturers have already announced that they plan to cut many jobs as air travel is expected to decline for at least the next 2-3 years.
As we covered in previous posts, the impact of the pandemic has produced an unprecedented decline in air traffic operations. Several organisations, such as EUROCONTROL and OAG, have been reporting the air traffic evolution during the past several months. The number of worldwide scheduled flights fell 65% during mid April (ref), compared with the last year. Similarly, the number of simultaneous airborne flights over Europe descended 93% in mid April, compared with 2019 (ref). In short words, most of the aircraft that flew daily above our heads suddenly disappeared.
Economical consequences aside, this pandemic has had other side effects. Some studies have revealed that there might be a strong correlation between air traffic decline and some inaccuracies detected in weather predictive models. But how could air traffic decline worsen the quality of weather forecasts? From my own experience, during the pandemic, most weather application services did seem somewhat uncertain in forecasting the weather conditions for the upcoming 7 days.
The European Center for Medium-range Weather Forecasts (ECMWF) is both a research institute and a 24/7 operational service, producing global numerical weather predictions and other data. They have developed their own atmospheric model and data assimilation system, called the Integrated Forecasting System (IFS). Models similar to these are usually placed behind popular weather API services, which are requested everyday by our laptops or smartphones. The data collected by airborne aircraft contributes to improving these predictive models; in particular, one of the main sources of these aircraft-based observations are Aircraft Meteorological Data Relay (AMDAR) reports. AMDAR measurements describe hourly observations from aircraft across the world during all stages of flight.
Last year, ECMWF conducted a benchmarking to see how dependent their forecasting models were on these aircraft-based observations. The results showed that the largest impact on forecasts is centered around 250-200 hPa, which is normally reached at 10-12 km in height. This altitude range matches perfectly with a typical cruising flight level (around FL320 – FL390). Furthermore, the model seemed show a larger impact on northern hemisphere regions when forecasting both wind and temperature. After observing the unprecedented decrease on air traffic operations, ECMWF stated that removing all aircraft-based observations will decrease the accuracy of short-range wind and temperature forecasts at airborne cruising altitudes by up to 15%, possibly causing significant degradations at all forecast ranges up to seven days.
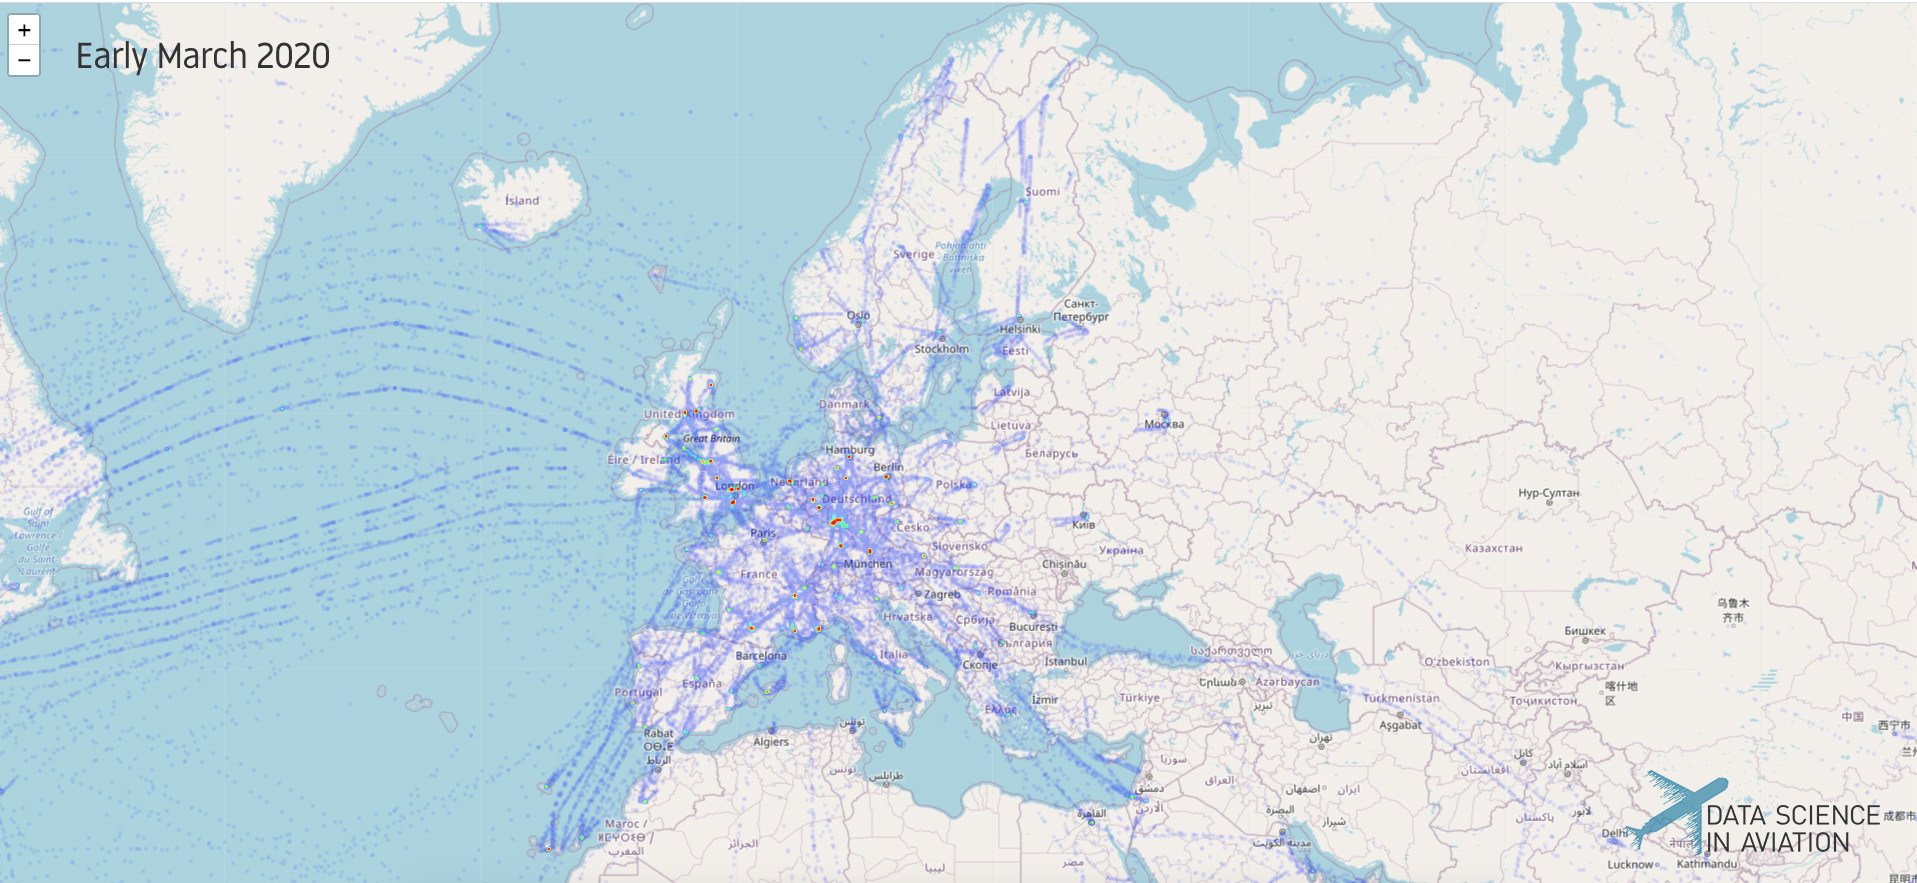
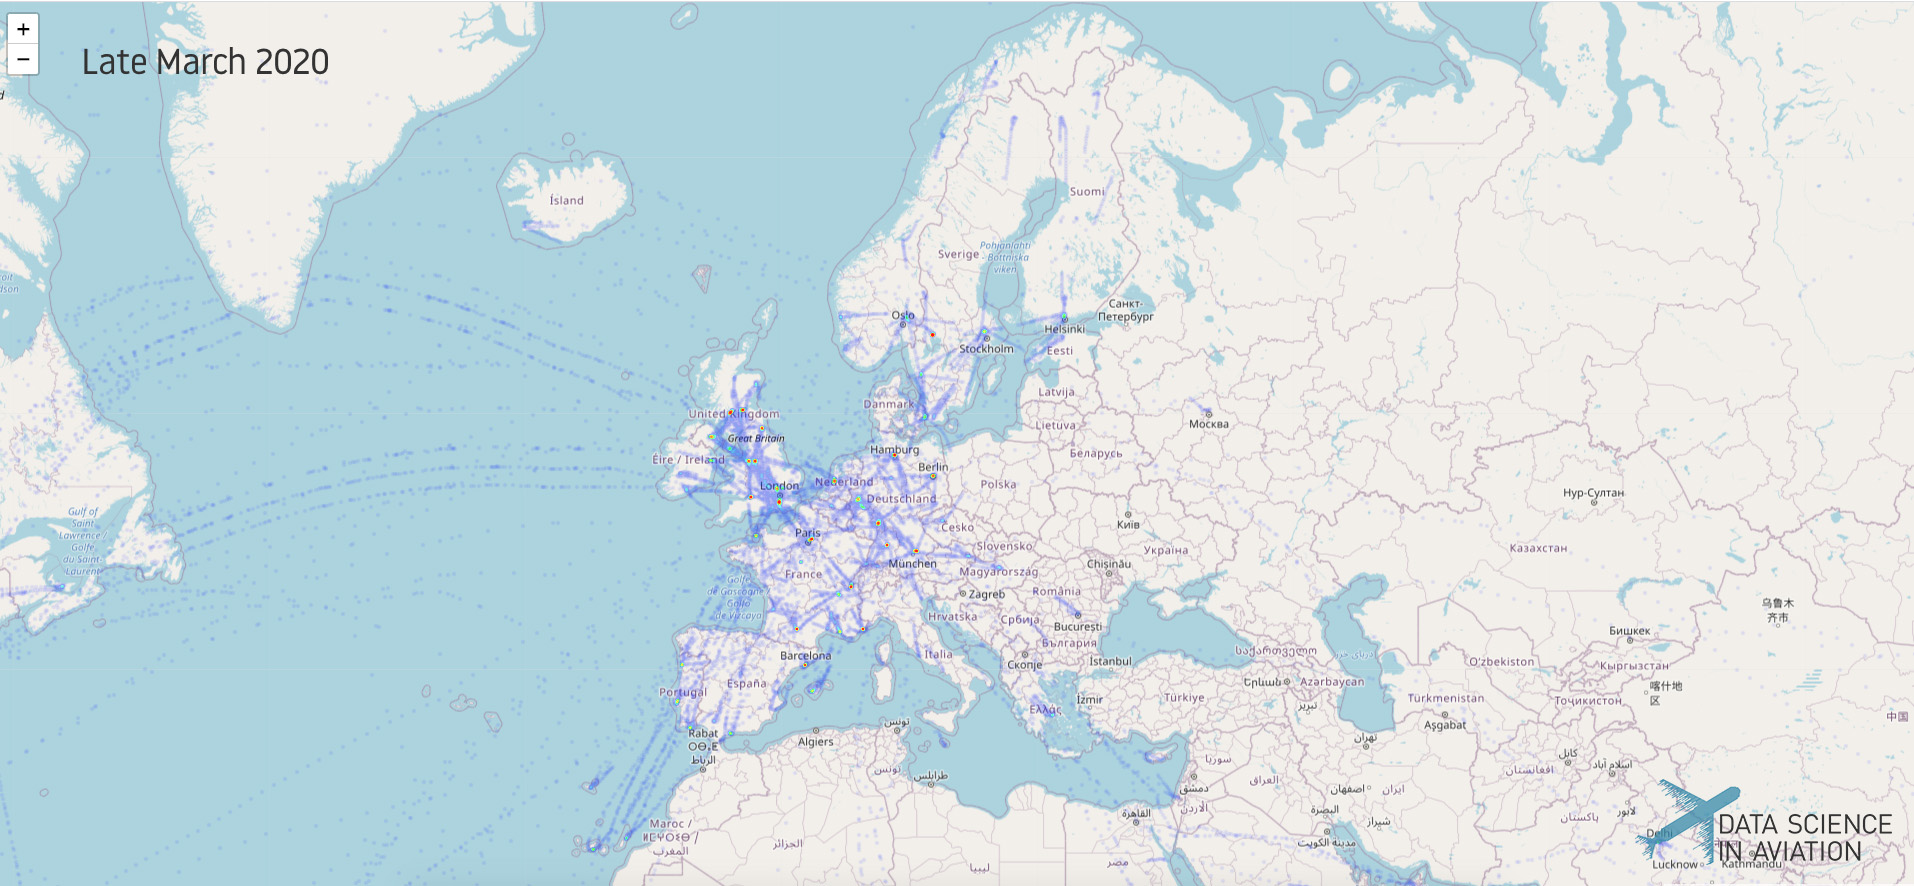
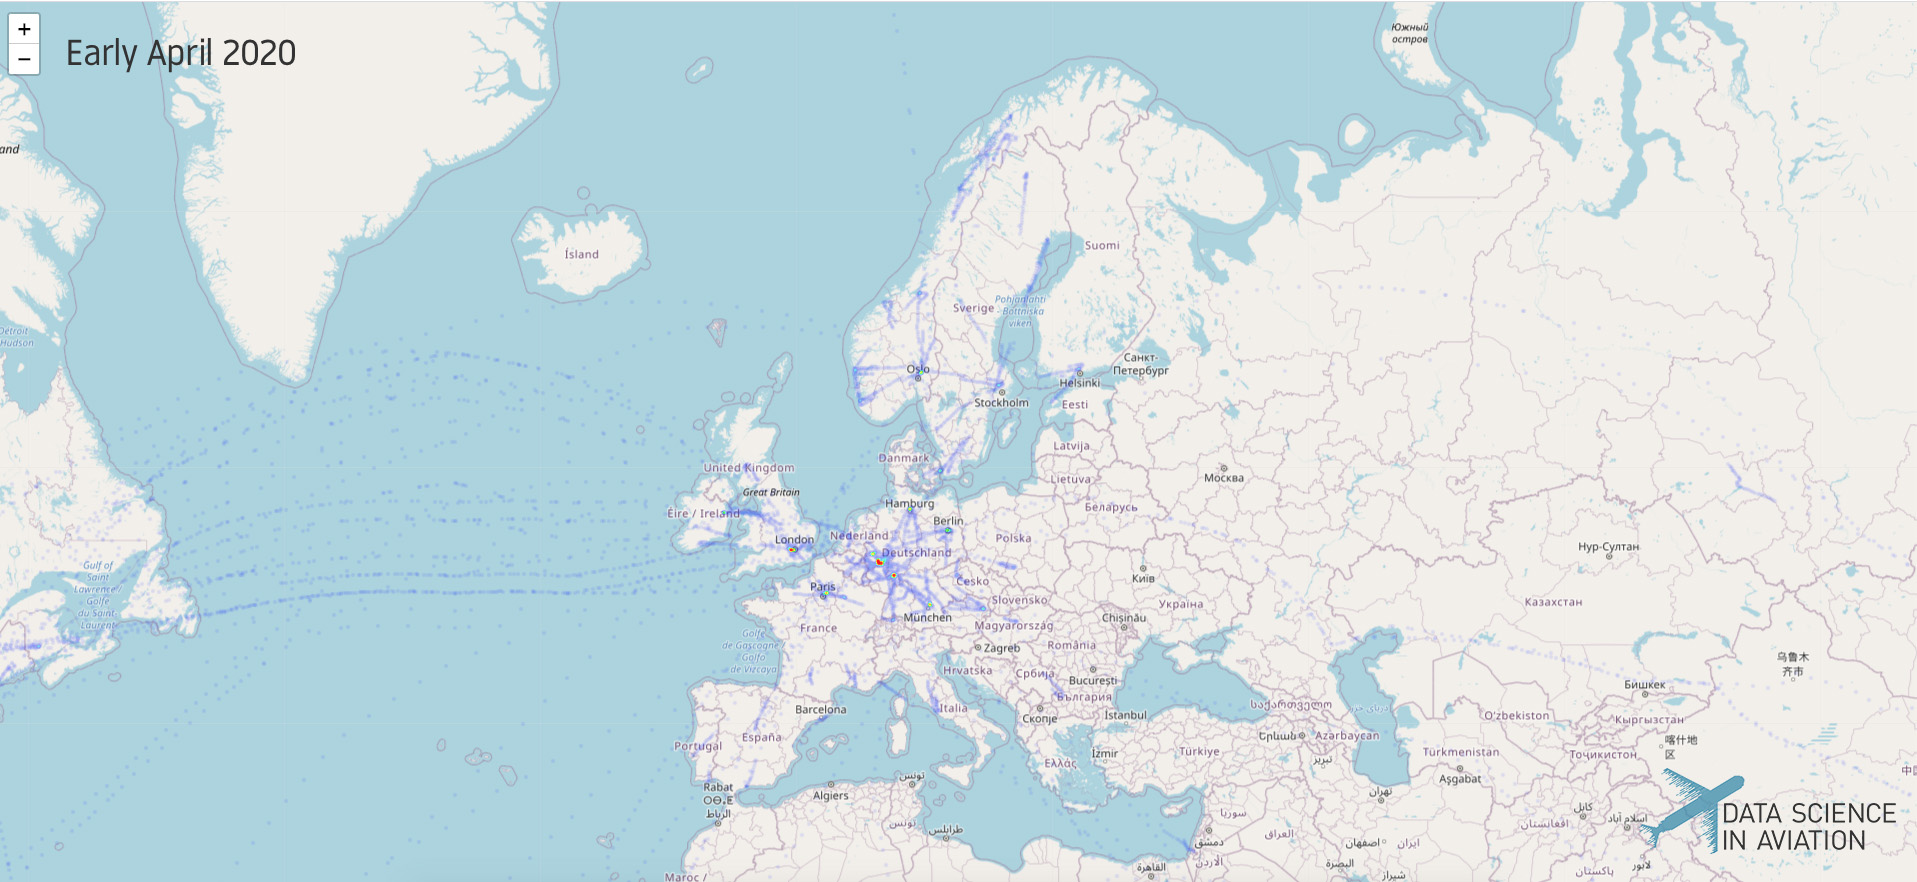
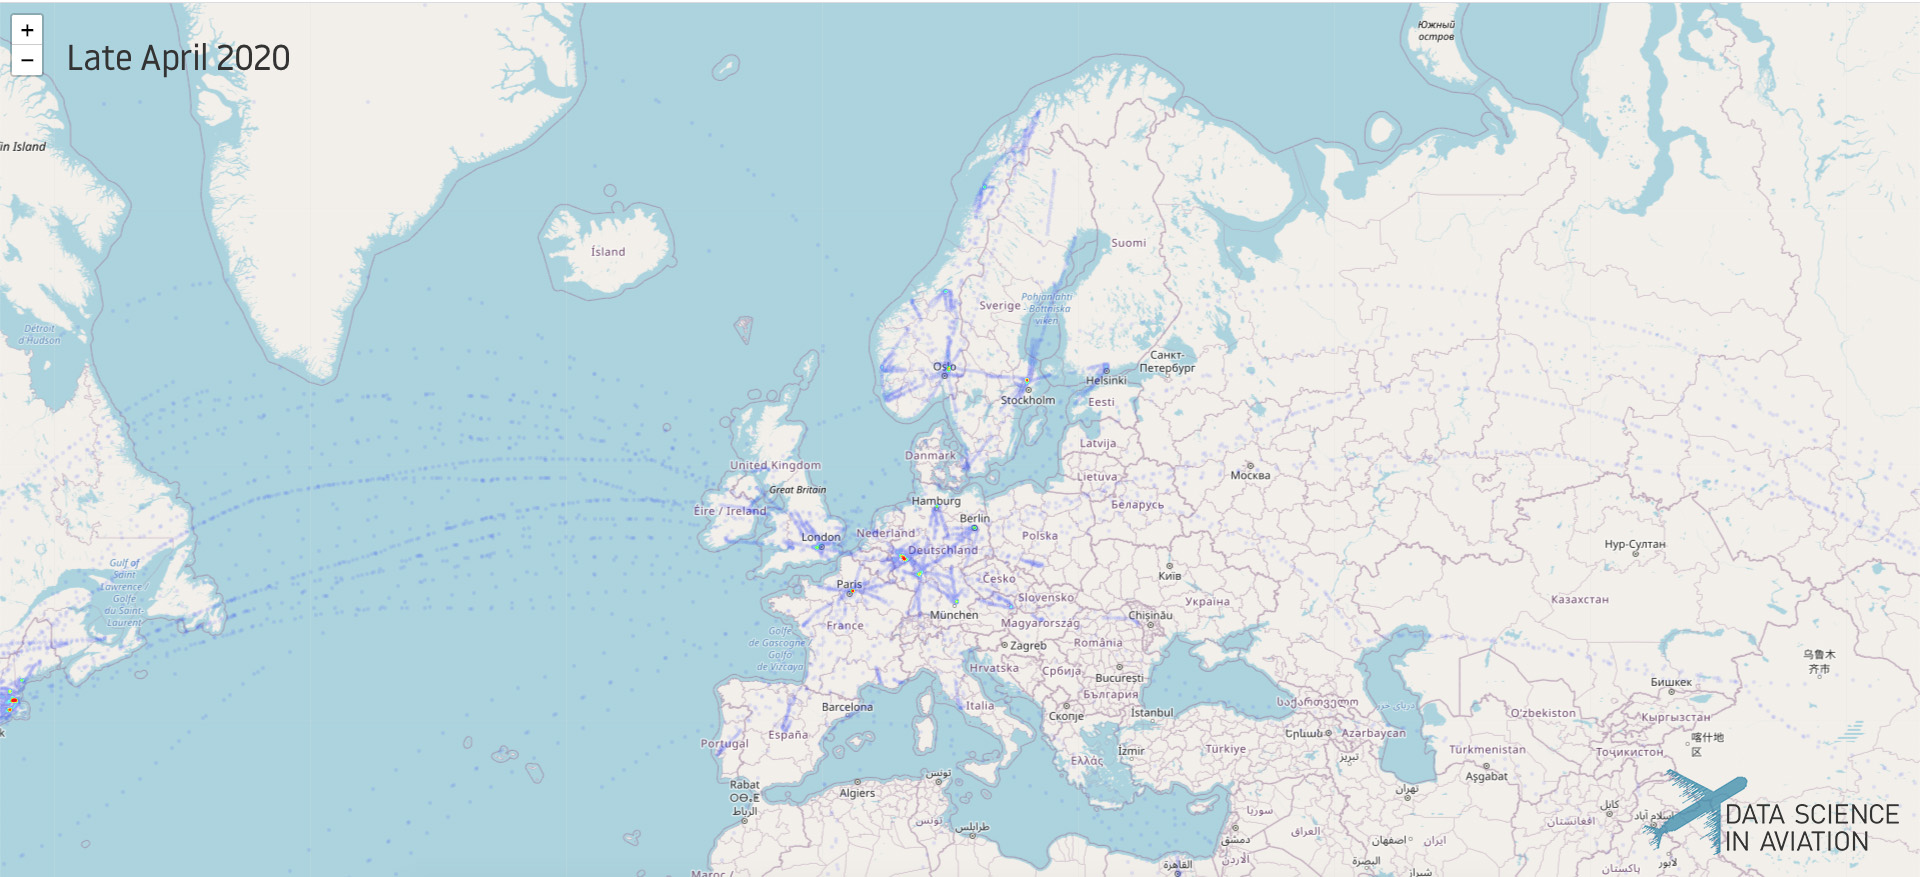
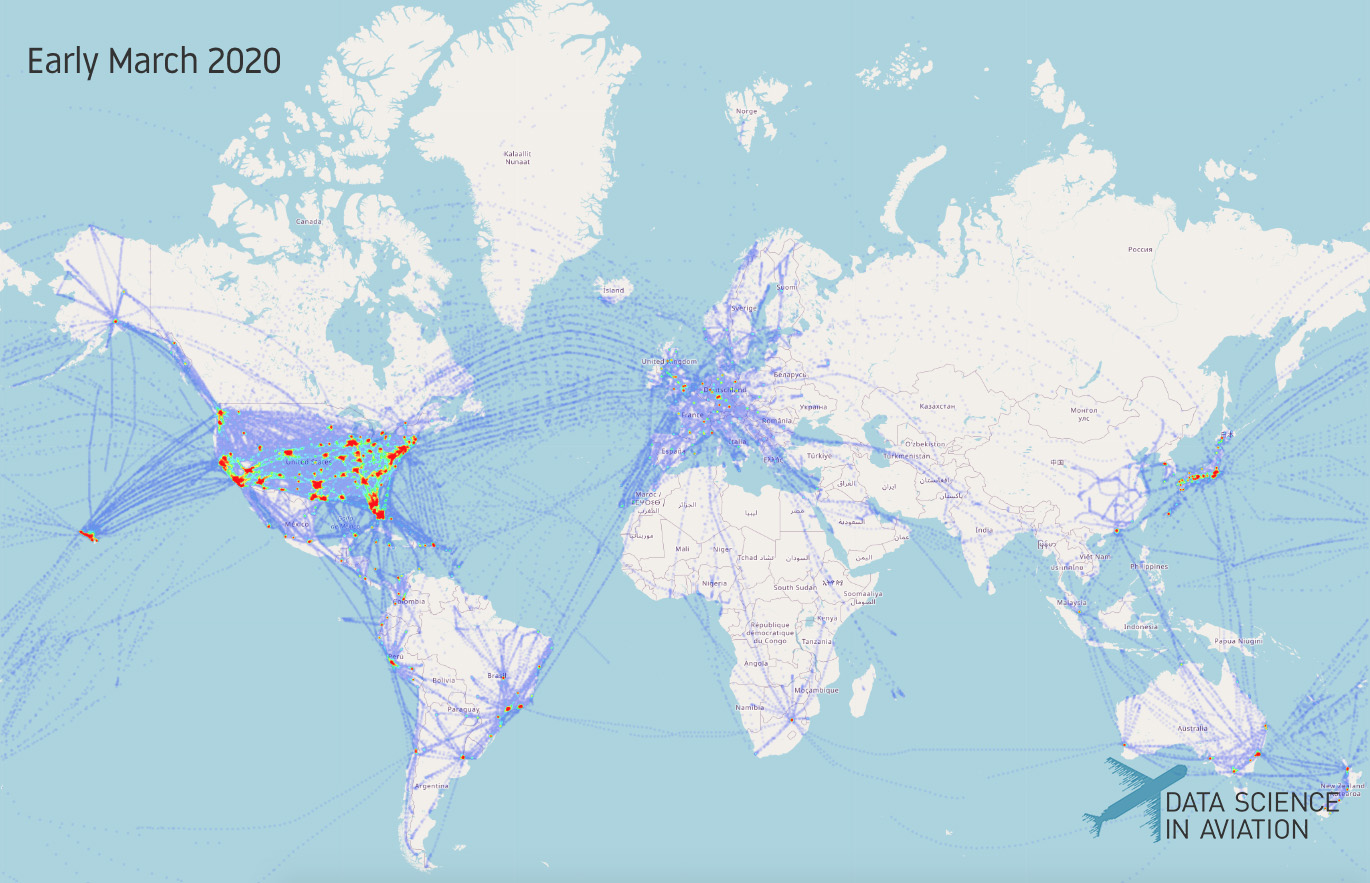
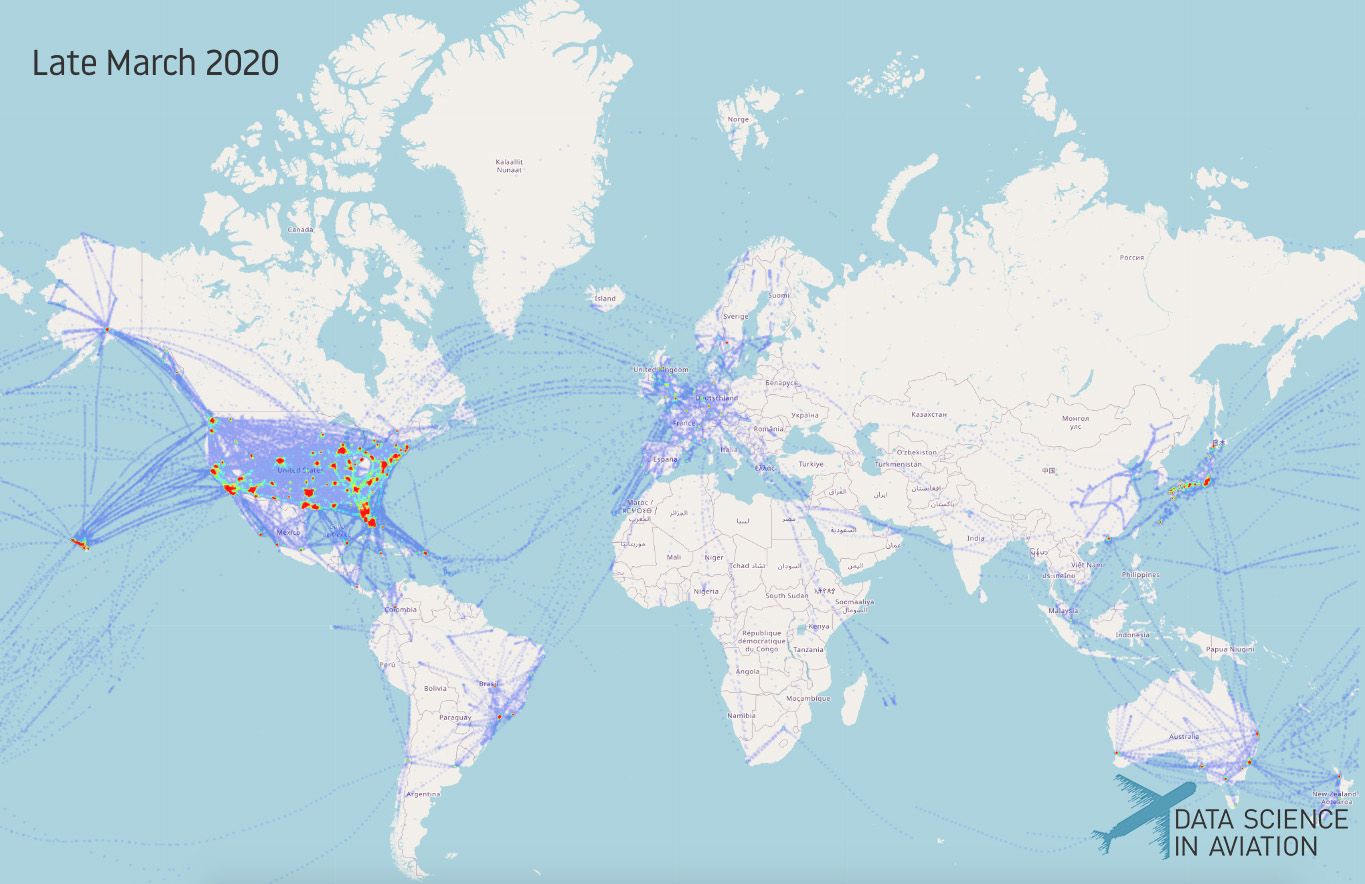
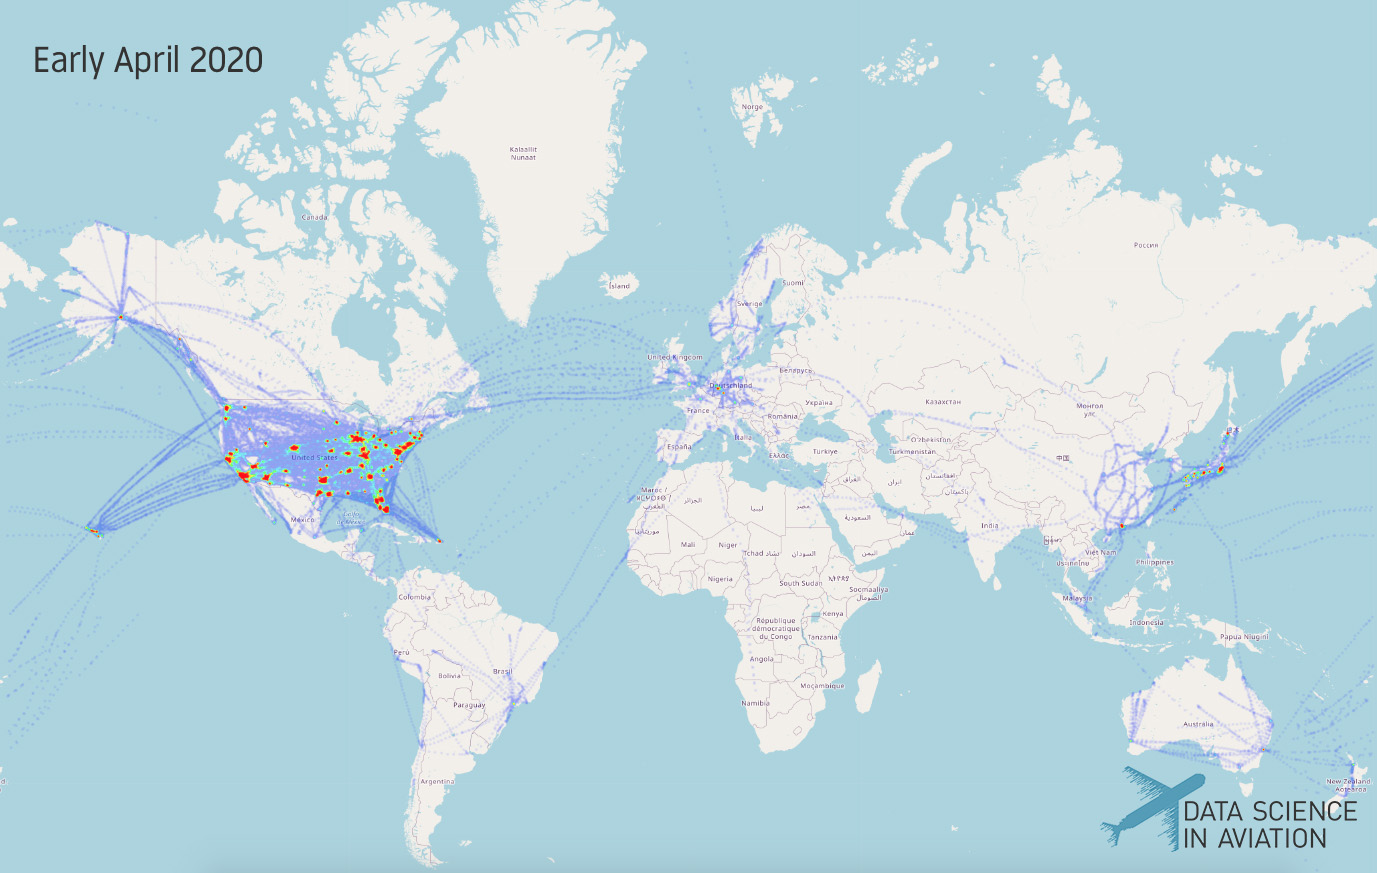
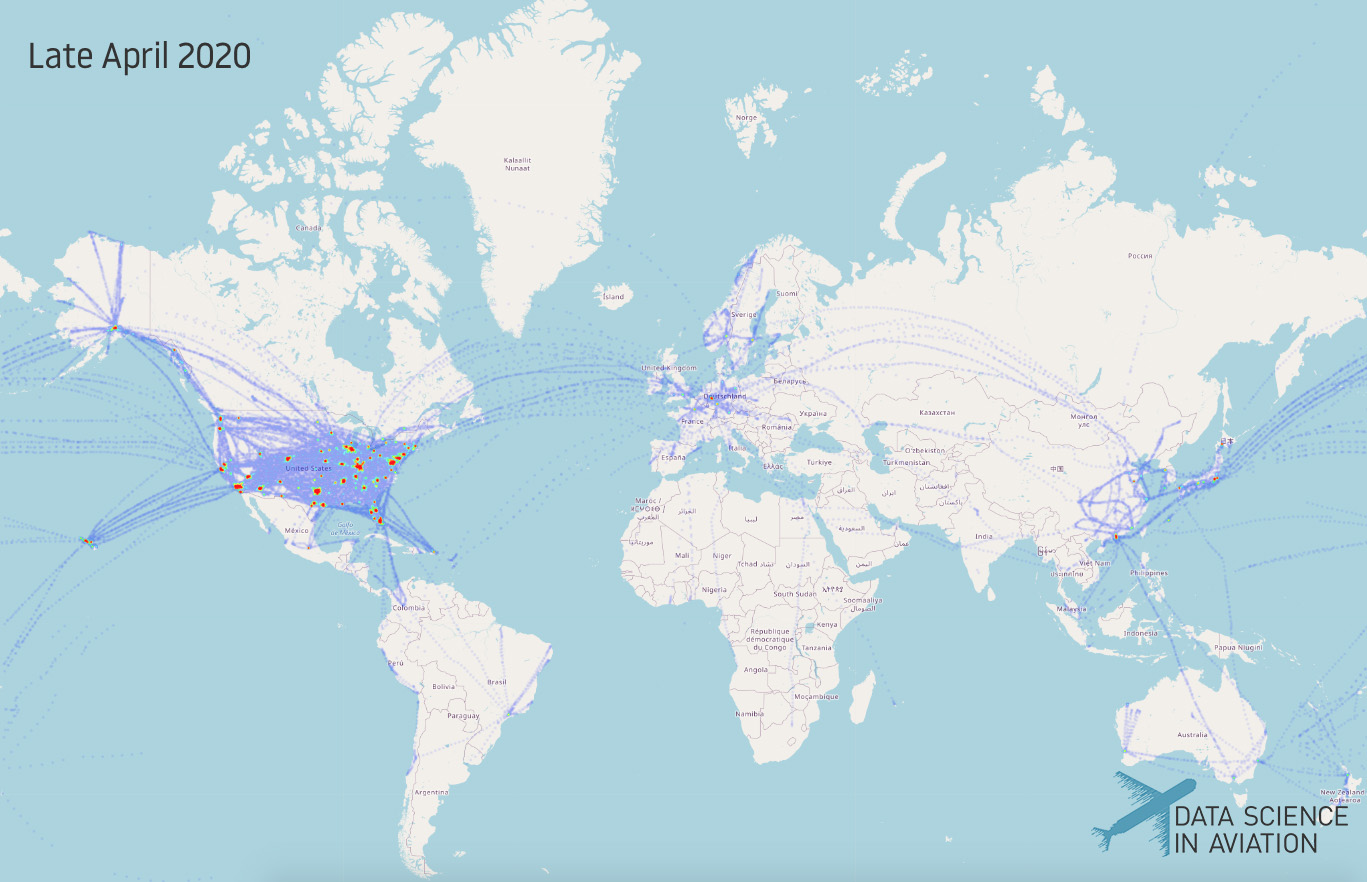
In this post, we are going to quantify how AMDAR observations have decreased compared with the same period last year. We’ve taken a look at AMDAR reports collected by Met Office and created some fancy visualizations and graphs using the power of data science. In Figures 1 and 1.1, we can observe some heatmaps describing how report coverage has drastically reduced from early March to the end of April.

