The impact of Covid-19 in European airspace: one month overview

Antonio Fernandez

2020-04-01 17:30:18
Reading Time: 4 minutes

Not a day goes by without news of Covid-19 and its devastating consequences — not only for humans, but for the economies of multiple industries, especially aviation. Since first appearing in Wuhan, China in late December, the virus has rapidly spread to multiple countries, directly impacting our lives and changing how we see the world. Human losses aside, the socio-economic impact produced by this pandemic has been huge, and its recovery will be a slow and complicated process.

Though almost all industries of the world will be affected by this crisis, aviation stands to suffer the brunt. In Europe, the outbreak began in Italy on February 21, when the amount of infected people began to increase uncontrollably, leading to a lockdown of 60 million residents on March 8th. As expected, other nearby countries like Spain, France or Germany followed suit, thus restricting airspace and cancelling all arrival and departure flights in order to curb the virus spread.

These restrictions have seriously disrupted the airline industry. Some estimate that the combination of trip cancellations and country-specific restrictions on international flights will cost the industry around $880 billion (ref). Many airlines have announced that they are at risk of going bankrupt due to the unexpected amount of cancellations and lack of customers. If one upside can be allowed from the Covid-19 pandemic having essentially “flat-lined” the industry, aviation emissions have drastically decreased in 2020, which have suddenly become unusually low (ref).

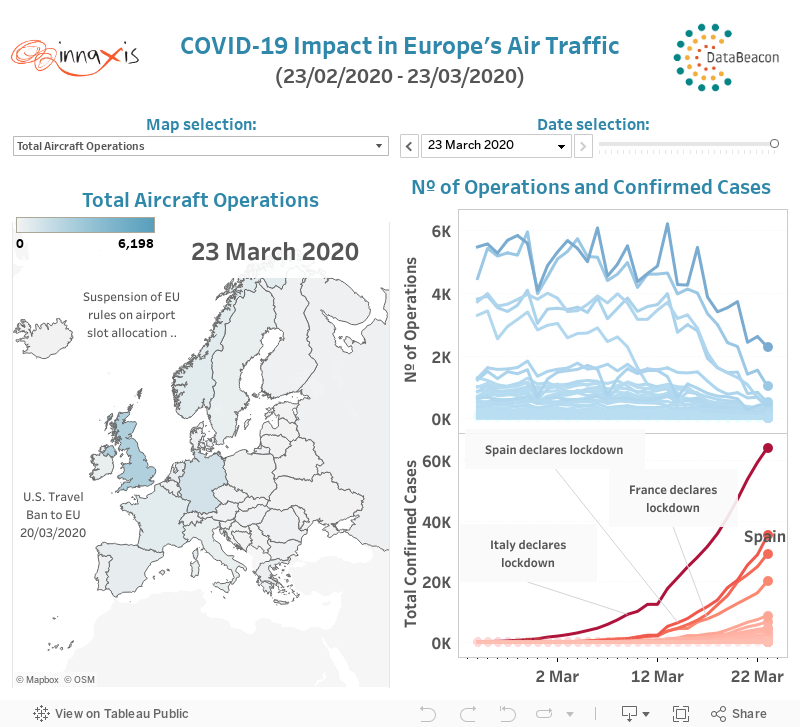
In this post, we will extract some insights by visualizing data. We have studied the evolution of aircraft operations during the last month to measure how Covid-19 has impacted the industry from a data science perspective. To build this report, we have mainly used flight plans that contain information about flight status to measure the amount of flights cancelled within Europe. In addition, we have also used the Covid-19 public dataset (ref), which contains the confirmed tested cases of Covid-19, the number of deaths from the disease, and recoveries, aggregated by country and worldwide.

We extracted the data from February 23 to March 23 for all flight operations that departed or arrived in European countries. The peaks correlate very well with the strict measures adopted by the governments of certain countries. For instance, observing March 8, we notice how flight operations surprisingly collapse in Italy due to lockdown restrictions. The same occurs in Spain on March 13, where an alarm state was announced to citizens. In fact, we can observe that Spain restricted inbound and outbound traffic despite having 2.143 fewer confirmed cases of Covid-19 than Italy at the moment they adopted identical contention measures. We encourage you to play with Dashboard 1 to extract further insights about the correlation between the Covid-19 measures and the descent in European flight operations.

Dashboard 1: Flight Operations and COVID-19 confirmed cases datasets from February 23 to March 23 in Europe.

How has Covid-19 impacted airport capacity?

If we analyze the situation from an airport point-of-view, we can clearly see how overall traffic has decreased along the past weeks. From Dashboard 2, we can analyse how flight operations have steeply decreased in about 7 days for most European countries. As for the 23th of March, airlines have most of their fleets on ground and sometimes use them to move cargo, sanitary material or repatriate people trapped abroad.

Dashboard 2: Flight Operations in Europe aggregated by week and airport from week 9 to week 12 of 2020.

How did the routes changed in the last few weeks?

We studied how air traffic evolved from week 9 (February 24) to week 12 (March 22), measuring the total amount of actual operations executed in the European region. If we look at specific routes (origin-destination pairs), we can see that the most affected airports were Spain and Italy, followed by other countries like Portugal, France and Germany. Although these countries were the first to restrict the airspace, this kind of measures indirectly affects traffic across the entire network.

Feel free to play with Dashboard 3 and Dashboard 4 to get more detailed insights about how Covid-19 has affected your country. You can check route traffic difference for any European country.

Dashboard 3: Difference in Flight Operations by route (origin airport – destination airport) from week 9 to week 12 of 2020

Dashboard 4 gives us the top 20 busiest airports in Europe along with which suffered the greatest decreases (darker color) in number of operations. For instance, if we select LEMD airport in Spain, and only consider arrivals, we can see how almost all national connections have been cancelled and how some international routes remain active with much less frequency.

On the other hand, we can observe the opposite effect in airports like EIDW in Ireland, where the amount of operations decreased indirectly because of restrictions adopted in adjacent European countries. Therefore, a low to moderate drop can be noticed if we filter the operations for this specific airport.

Dashboard 4: Covid-19 impact in Europe’s airports from week 9 to week 12 of 2020.

Without a doubt, inspecting the data, we can anticipate this pandemic to have huge consequences for the aviation industry. However, things keep changing and it’s still too early to forecast how long this crisis will last. It’s difficult to quantify the overall impact or resulting losses, in any aspect, that this crisis may entail.

How greatly will Covid-19 reset the aviation industry? Can we expect a market distortion due to governments investments in the industry? Can we expect fewer corporate travels in the future as the crisis might encourage companies to promote work from home? Will airlines adopt stricter rules within aircraft cabins to protect passengers (hygiene, experience, comfort)? In any case, this catastrophe will benefit some sectors while damaging others, and we may have to wait until it passes to clarify most of these uncertainties.

We will keep an eye on data during the following months and analyse the evolution of the sector and its reactivation in the mid-to-long-term. We will publish an updated post discussing the crisis recovery after everything calms down.

Stay tuned!

References

https://www.oag.com/coronavirus-airline-schedules-data

https://www.washingtonpost.com/graphics/2020/world/corona-simulator/

https://centreforaviation.com/analysis/reports/covid-19-aviation-impact-capa-daily-update–13-mar-2020-517218

https://towardsdatascience.com/how-to-track-coronavirus-with-python-a5320b778c8e

https://nats.aero/blog/2020/03/weathering-the-storm-coronavirus-and-air-traffic-control/

https://github.com/datasets/covid-19

Coauthors: Antonio Fernandez, Darío Martínez, Pablo Hernandez

© datascience.aero