In any qualitative research using traditional methods, the researcher looks to achieve saturation, or often referred to as “the point of least surprise”. This is the point where you can reliably guess how a new participant will respond to prompts, therefore preempting diminishing returns in information. Scientists ask themselves: what sample size will achieve saturation? But answering this question requires having an exact baseline of knowledge about how diverse samples are and desired output. Given that correctly training Machine Learning (ML) models is in fact achieving saturation, discussing and understanding this topic is of high relevance for predictive modelling. In this post, we will present some of the best lines of action to correctly tune the size of your training dataset.

Understanding the complexity is the key

Unfortunately, no one can tell you how much you need for your predictive modelling problem. In fact, it is an intractable problem that you must solve through empirical research. However, it is known that the amount of data required for training a ML problem mainly depends on two factors:
- The complexity of the problem: Given a label vector y as the predictive target and a matrix of features X that describes samples of your problem, how complex is the function f such that y = f(X).
- The complexity of the learning algorithm: The methodology used to inductively learn the underlying mapping patterns and behaviours.
Machine Learning is not the new kid on the block anymore. Many people have applied predictive modelling to a wide variety of problems and some have published their results. Looking at studies that showed good results to problems similar to yours is very useful. By looking at the complexity of these proposed solutions, you can estimate how much data you need to solve your own problem. Such results may even suggest a specific algorithm that addresses a specific part of your problem, like data imbalance.
Another possibility is to ask domain experts, who understand well the complexity of the problem and even the exact scale of data to capture this complexity. At the end of day, having enough data is pivotal for reasonably capturing the complexity of the relationships between labels and features.
Use statistical heuristics (with caution)
If you are a statistics guy and you are trying to figure out a ML classification problem, don’t worry. Some heuristics can help you calculate the suitable sample size if you are using linear algorithms. Some examples are:
- Factor of the number of classes: It is desirable to achieve the order of tens, hundreds or thousands independent examples of each class. For example, on a binary classification, you are looking for 20, 200 or 2000 independent examples.
- Factor of the number of input features: The desirable features matrix should present a hundred of percent more rows than columns. For example, if you are looking to train a model with 80 features and you define a heuristic of the 20%, you should have at least 9600 samples.
- Factor of the number of model parameters: There must be N independent examples for each parameter in the model. For example, in a classification using a linear regression and an heuristic of N=10, the expected input is at least 20 independent examples.
Of course, most of these “heuristics” are just rough measures of the complexity of the problem (number of classes and number of input features) or measure for the complexity of the model (number of parameters). But don’t use these heuristics blindly, take into account that the most powerful algorithms in machine learning are non-linear algorithms. Well used algorithms such as Deep Learning with ANNs, Random Forests or Adaptive Boosting present very low bias but high variance. This specific trade-off requires inputs with thousands of samples while the linear models may require only hundreds.
The power of the “learning curve”
As you may know, visualization is the most powerful tool for testing machine learning algorithms. The learning curve is a graph that compares the performance of a model in training and testing data over a varying number of training samples. This curve allows you to easy represent how the model is generalizing new data or if it has achieved saturation.
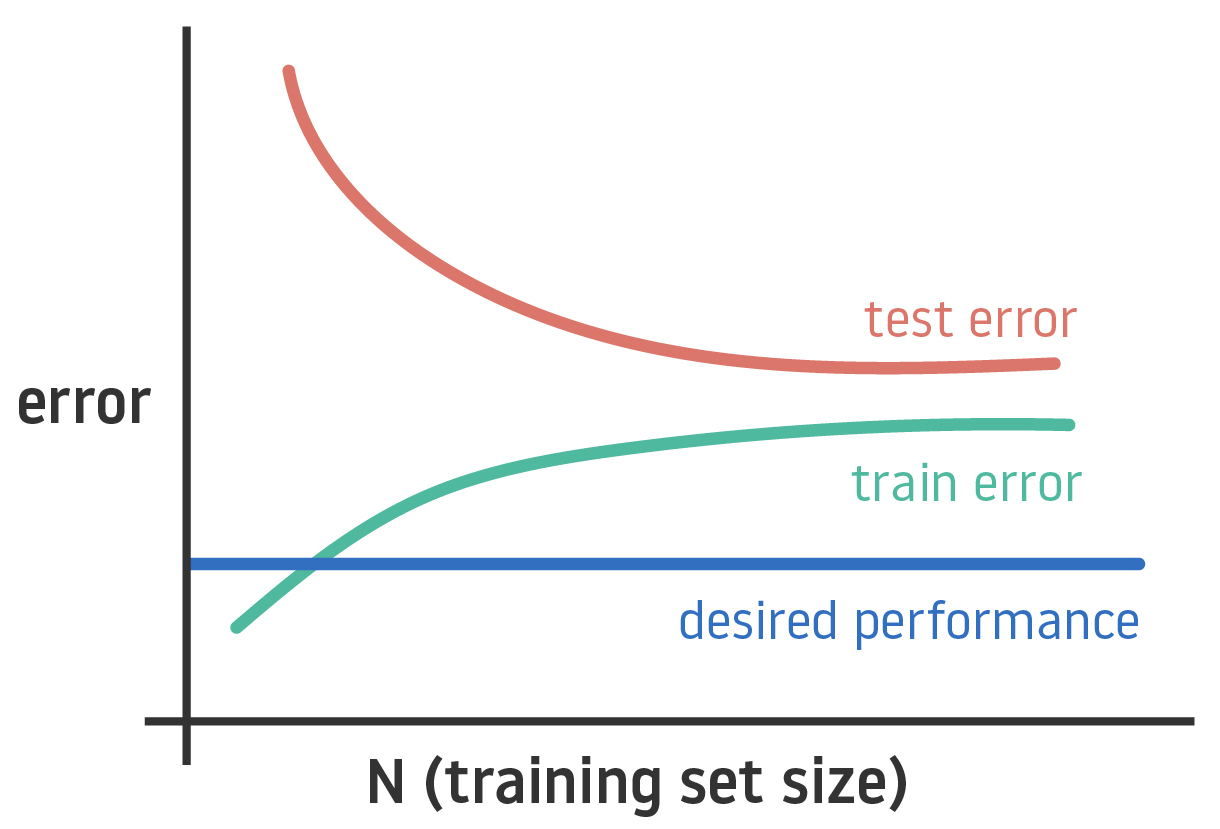
From analysis of the learning curve, you can also extract if your model presents high bias (your data is underfitted) or high variance (your data is overfitted). You can deal with these two problems by getting more data (by increasing the volume but also the variety of your dataset).