GRIB files: Encoding weather data
Ernesto Gregori
GRIB files: encoding weather data
While working with data, we may encounter many different file formats depending on different factors, like reading performance or file size. The most common data formats are csv and parquet, but there are many other options, each suitable for certain tasks.
A good way to encode weather data is with the GRIB format. It stands for “General Regularly distributed Information in Binary form” and is standardized by the WMO (“World Meteorological Organization”) to provide gridded data.
What makes GRIB format so convenient for meteorological data? The main advantage of this file format is the way the data is represented. Common data formats use tabular representations: in order to retrieve a specific value, we have to specify the column and the row. For example, if exploring the Iris dataset, we could select the value from the third row and the column Sepal Width. The tabular format is the most common data representation, and the one that we are most familiar with. However, other data representations have been developed to perform specific tasks in a more efficient way.
GRIB files aim to represent different weather observations or forecasts over a grid. There are actually several layers of information over the grid, so we can think about it as many grids stacked on top of each other. Some examples of the information that can be contained in the different layers are: temperature, wind components, visibility, relative humidity or geopotential height. Furthermore, some of the features contained in the layers may be available for different altitudes (in aviation it is referred to as flight levels). As a result, the same feature may be described in many layers, one for each flight level available.
While pandas is the most widely used Python library for tabular data, GRIB files have to be processed with a different library. One of the most popular options is pygrib, a library that allows the reading and processing of GRIB files, such as the NOAA weather forecast.
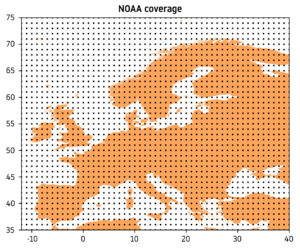
In the above image, each position where NOAA forecasts are available is represented by a black point. We can see that the coverage is uniform and provides access to information for all Europe (it covers the whole Earth’s surface, in fact). After opening a NOAA file with pygrib, we can access more than 350 features for each of the points where the information is produced.
Therefore, GRIB files are a great way to make weather information accessible as a standard format in this area, and there are tools to use this file format with popular programming languages like Python.