Determining the surroundings of a flight trajectory
Ernesto Gregori
What does knowing a “trajectory” mean? Does this entail knowing the position of a plane at every minute? Or, more precisely, should we know its position every 30 seconds? 10? The answer to this problem really depends on the use case, since we have to assume that infinite precision is impossible and that, as a result, we have to identify the minimum sampling ratio for each application. However, for some particular cases, we can use “tricks”, like not working with the trajectory itself but with its surroundings.
Therefore, given a set of discrete points (remember, we don’t have infinite precision) that represent a trajectory, we may want to know the passed areas near to said trajectory. This information can be useful for many reasons, like for studying the weather in these surroundings.
A common option is to use grid-based geographic indexing systems, such as Uber’s H3 hexagonal grid system (if you want to know more about it, we have already discussed it here).
But if we work directly with the original discrete points, we may encounter a problem: if two points are too far apart, we end up skipping some cells and gain inconsistent information.
This can be solved by interpolating the trajectory between the real points, which gives us a higher resolution. However, this operation is computationally expensive and results in the total time being drastically incremented, especially if many flights are processed.
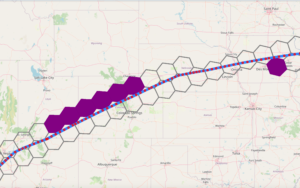
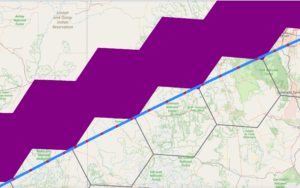
The above trajectory is a clear example of what we have already mentioned. The red markers correspond to the real trajectory and the blue markets to the interpolated points. The gray cells are the ones obtained with the real trajectory (and therefore can also be obtained with the interpolated trajectory), while the purple cells only appear if we use the interpolated trajectory; we miss them if we only used the real trajectory.
By zooming into a specific area, we can see what happens: the original red points are located quite close to the missing cells, but since they were not originally connected, they skipped these cells because of the sampling frequency.
A different approach to solve this problem that doesn’t involve interpolation would involve incrementing cell resolution (using smaller cells) and considering a higher degree of neighbors. Instead of just having large cells where the point are located (with the gaps corresponding to the purple cells), we would have smaller cells with their neighbors up to a number of degrees (for example, two degrees of neighbors). This would smooth our result since the gaps would be filled. And most importantly, the computations required for these actions are not intensive, so the processing time wouldn’t increase as much as with the interpolation.