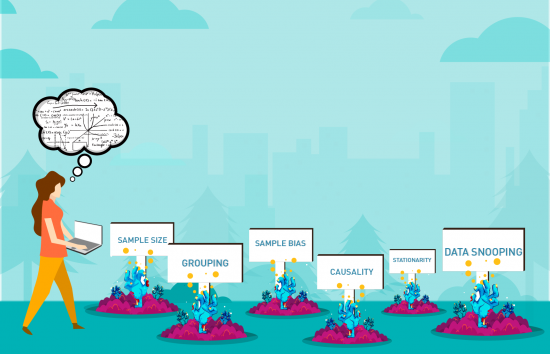
It is important to know about the challenges one can encounter in any data mining pipeline in order to successfully extract knowledge from any dataset coming from system (e.g. air transportation). Below, we list some of the key challenges:
1. Sample Size
The amount of information that explains a phenomenon is limitless – and for that reason it should be noted. Richard E. Bellman first introduced the concept of the dimensionality curse- indicating that given sufficient number of attributes, any pattern can be mimicked. In other words, when you have the same number of attributes (or variables) and observations, it is always possible to explain the latter as a linear combination of the former even though the combination is completely random and based on coincidences due to the large number of explaining variables. Take for instance, the following case:
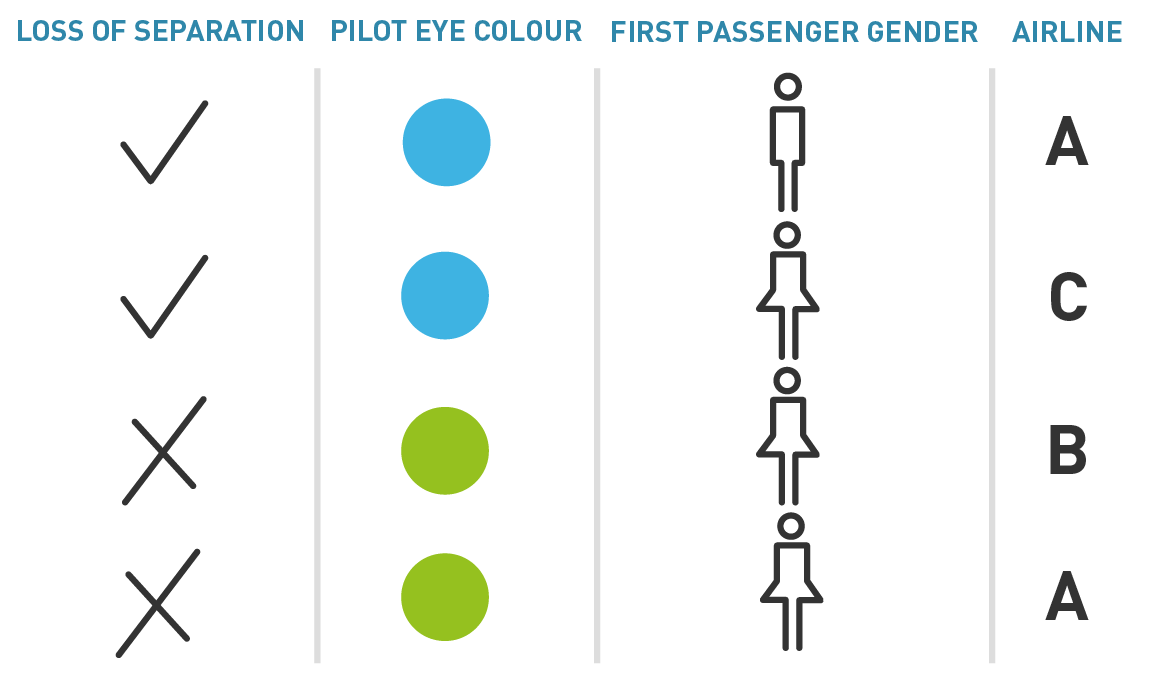
According to the table, it would initially appear that the pilot eye colour may be correlated to a loss of separation event. Therefore, it is critical to demonstrate the feature selection process that must accompany any data mining approach.
2. Grouping
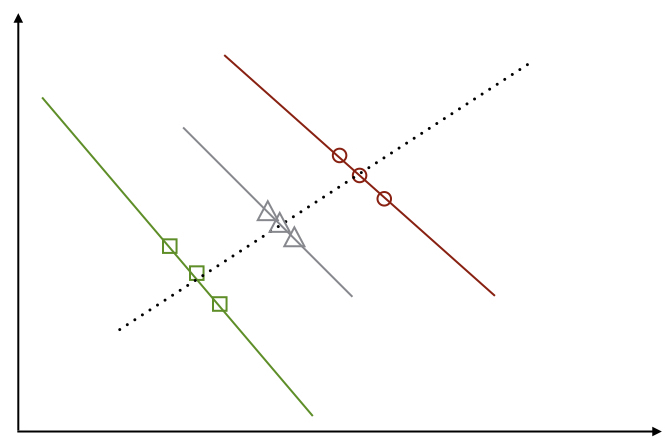
Due to the small amount of data for a certain type of event, one could be tempted to aggregate data from similar instances, and then observe spurious correlations that lead to erroneous conclusions. This practice is called the Simpson’s paradox (or Yule-Simpson effect), which explain the appearance of trends in the aggregated data set that are different from the trends present in the non-aggregate data.
Let us imagine the following situation: three groups of data (different airlines represented by green squares, red circles and grey triangles) all display a common trend; i.e. a negative correlation between features 1 and 2 (black, grey and red solid lines). When all airlines are jointly analysed, a spurious positive correlation appears (dashed black line).
3. Sample Bias
Additionally, sampling data must be carefully executed as the negative trend extracted from one airline must not be extrapolated to the whole system. Specifically, if the data is collected in a biased way, such bias will also carry over in the knowledge extracted from the data; hence the importance of having test and training data extracted from the same distribution. In other words, it is important to ensure that the training data is representative of the entire universe, or else risk the drawn conclusions might be invalid for a new set of records. This has also been studied through the complex network paradigm by Seddik Belkoura and Massimiliano Zanin, showing the way a sampling of airport or airline conditions the network – therefore biasing the system representation and the subsequent knowledge that we assume to gain from it.
4. Stationarity
Each previous condition is somehow linked with the stationarity condition, mainly due to a large number of techniques that require the stationarity of the time series for the conclusions to hold. In this context, the patterns are defined as non-stationary if their statistical properties depend on time; in other words, making it possible to link some patterns to specific time-scales. This is important when considering the foundations of data mining: observations used to create a model must be representative of the whole universe. That is, the time series must not change their statistical properties through time as it risks not being representative of the whole possibilities. As an example, extrapolating the results of a study performed on Saturday traffic for the entire week might yield irrelevant conclusions.
5. Data Snooping
This challenge is perverse as it compromises the outcome of the data mining process, yet in a subtle way that can be easily missed. Essentially, the validation data set could be “stained” by the training data. Usually this occurs when the scientist performs a normalization of the information before splitting the data, resulting in the testing data divided by an amount that contains information about the whole set of data. This will generally result in a less powerful model.
6. Causality
Causality is difficult to prove, and the reader should be very careful when using it. The common pitfall is to assume that a strong correlation implies causality. Many examples exist of spurious correlation that have nothing to do with causality. Imagine two airports with similar delay patterns. One might therefore be tempted to conclude that the dynamics of one is driving the dynamics of the other. However, it might be possible that a third airport, or a non-considered factor, might be driving the dynamics of the two aforementioned airports. Therefore, it is primordial to not confuse correlation with causality, and to instead use adapted causality metrics depending on the situation you are studying.