5 Machine Learning applications using surveillance radar (ADS-B) as the main data source

Antonio Fernandez

2020-05-13 14:24:49
Reading Time: 5 minutes

In the aviation world, there are plenty of data-driven use cases arising not only within aviation-related organizations, such as airlines, manufacturers or ANSPs, but also among R&D projects. Almost all of these use cases are limited by the same constraint: the availability of the data. In order to guarantee a minimal reliability in the results, a decent amount of data is needed. In most cases, data sources are private, which limits a lot the potential of the innovative solutions. Due to this, it crucial to identify publicly available data sources first and, second, to understand the potential case studies that can exploit the usage of these data sets.

In this post, we will delve into one of the most popular data sources in aviation industry: ADS-B. Automatic Dependent Surveillance Broadcast (ADS–B) is a surveillance radar technology in which an aircraft determines its position via satellite and periodically broadcasts it, enabling tracking from the surface. Ground stations have installed multiple antennae to continuously collect this data, contributing to huge data silos with global airspace routes. Fortunately, there are lots of ADS-B historics, and it’s quite easy to access this kind of information. One disadvantage of using ADS-B is the lack of ground-based transceivers, with some shadow regions without antennae unable to provide data. Sometimes this can lead to slight incongruities along the flight course. Assume that ADS-B data is composed of these columns among others: altitude, callsign, heading, latitude, longitude, time, velocity, vertical rate and on_ground.

We are going to present 5 simple data-driven problems that, in our humble opinion, are very trendy nowadays in aviation fields, and we are going to apply machine learning techniques to solve them. Particularly, we will approach all of them assuming that ADS-B is the only data source available. In addition, we will propose other data sources that exist in aviation (Ref. Aviation Data Compendium) that might support the information provided by ADS-B.

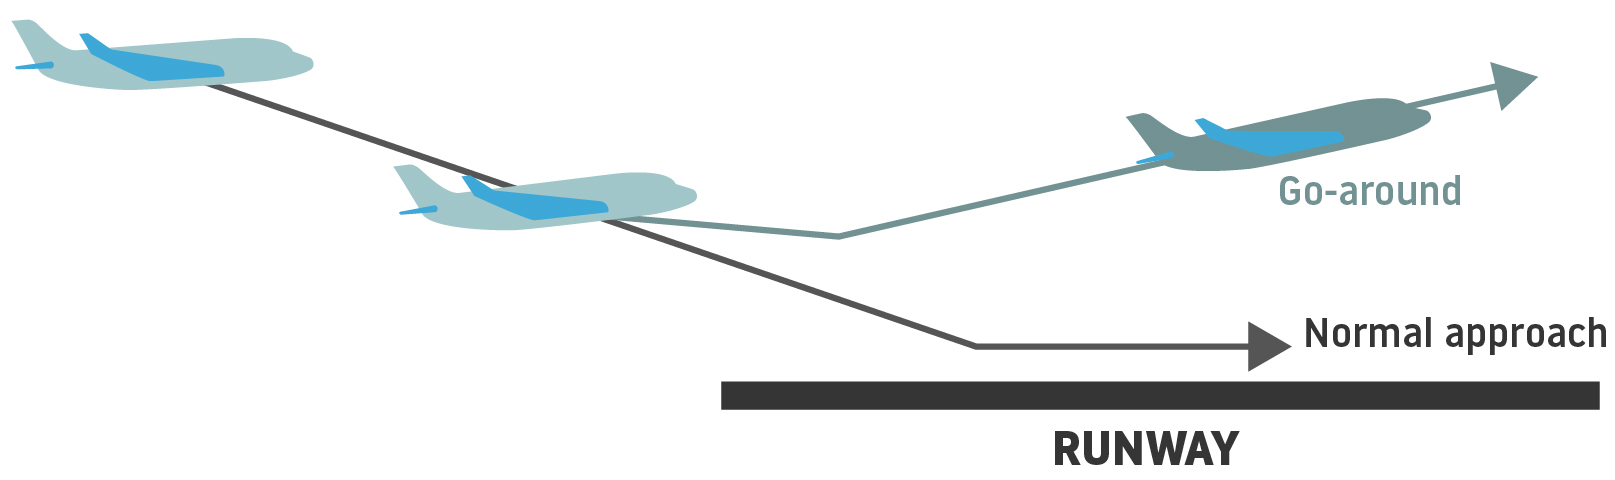
1 – Predicting Go-Arounds maneuvers

The predictability of go-arounds is quite an interesting problem to solve; its solution can help mitigate the effects produced after it occurs. From a machine learning point-of-view, the main inconvenience of this use case is the data imbalance problem. Since this event happens in about 0.3% of operations, if we try a binary classification problem predicting 0/1 if a go-around occurs, the model will need equality between the classes to learn more of go-arounds. Another challenge will be the labelling of the data, since we won’t know at glance if a certain flight experienced a go-around just by looking at raw ADS-B columns.

In this case, how can we detect a go-around by looking at ADS-B logs? Most go-around maneuvers share some similarities in aircraft behavior:

  • Full or maximum allowable takeoff power must be applied until flying speed and controllability are restored.
  • The nose should be kept from pitching up too soon, with an altitude that permits a buildup of airspeed well beyond the stall point.
  • The flaps and gear will be retracted.
  • The rate of descent must be positive.

From these patterns, even without all the information, it’s feasible to look over flight trajectories in ADS-B that meet these requirements (speed, altitude, heading), and label them as potential go-arounds. Afterwards, we could set a prediction point a few minutes before the touchdown point and see if we can predict (0/1) if a go-around is about to happen. Of course, weather features, like METAR or wind profiles, measured at runway surface will highly improve the model accuracy.

2 – Loss of Separation (LoS) hotspots

We understand a Loss of Separation (LoS) to be when two airborne aircrafts breach the separation minima established by the controlled airspace. When surveillance systems are used, for instance ADS-B, the minimum horizontal separation between two adjacent planes should be at least 5 nm, and vertical separation for IFR flights as 1000ft below FL290, and 2000ft above FL290. These rules might change a bit depending on the airspace. Similar to the previous use case, it’s possible to label pairs of trajectories to detect losses of separation between aircrafts.

From a machine learning perspective, it might be interesting to identify geographical regions more prone to induce or become associated with LoS, probably by using unsupervised learning techniques to infer patterns between observations and set clusters. These results could be plotted in map through hotspots indicating when and where LoS happen. In this case, machine learning aids to better understand the precursors of this kind of safety event to prevent similar situations in the future.

3 – Sector Occupancy

The ADS-B radar is composed of multiple time series from different flights flying across different sectors. Sectors are nothing more than a visual segmentation of airspace, distributing the control workload into different ANSPs. The trade-off between sector capacity and demand is always present in the ATC world. The opening/closing of sectors should precisely monitor the demand in order to achieve efficient use of all available resources. It’s important to know the expected sector demand in advance so that airlines can dispatch their flights properly.

Multiple studies can be performed to optimize sectorization using ADS-B temporal series. For instance, we could aggregate the data hourly per sector and analyze the evolution of the sector occupancy at different hours of the day. Afterwards, we could apply machine learning to train a regressor able to forecast the demand for a specific sector at a given time. Nevertheless, this proposed approach is a bit rough since regulations, weather events or delays will directly affect how air traffic flow is managed, and surely more variety of data will be needed.

4 – Air Routes profiling

In aviation, there are multiple ways to travel a route in terms of origin to destination (OD) airports. These routes are normally pre-established, and depending on external factors, aircraft might change the followed path. A possible case study using ADS-B would be to analyze all the extant ways of reaching the destination for a given OD-pair, profiling routes for any airport combination. This could improve the waypoints selection and provide insights into how route selection works and the best way to optimize this process.

Machine learning could help select the optimal trajectory during pre-tactical phase, considering the context of the flight (en-route weather events, airspace regulations), and also provide better insight into the precursors of each flight path, detecting common procedures repeated for certain OD-pairs, such as fly-by-waypoints or directs.

5 – Flight Phases identification

Last but not least, ADS-B can be used to further investigate the flight phases along a certain route. In general, a flight is composed of multiple phases. For instance, a departure can be subdivided into other specific sub-phases, such as pre-flight phase (passengers boarding, maintenance checks etc), engine start, ground operations and take-off. The same occurs with en-route and arrival steps, starting with the climb, cruise, descent (including holdings) and the final approach to the assigned runway. If a landing attempt fails, then aircraft could experience a go-around or touch-and-go. With ADS-B, some of these flight phases could be identified and trajectory vectors could be labeled, providing more detailed information about the flight.

Afterwards, by using machine learning, we can analyse the duration of these phases and the similarities between identical routes, and maybe try to forecast some of them in advance. An estimation on the number of holdings, taxi times, or time-to-board particularized for an airline might be crucial for dispatching flights as optimally as possible.

References

https://www.faa.gov/regulations_policies/handbooks_manuals/aviation/airplane_handbook/media/10_afh_ch8.pdf

© datascience.aero