What are topic models and why is their interpretability important?
Topic modelling algorithms, such as Latent Dirichlet Allocation (LDA) which we used in the H2020-funded coordination and support action CAMERA, are a set of natural language processing (NLP) based models used to detect underlying topics in huge corpora of text. However, the interpretability of the topics inferred by LDA and similar algorithms is often limited. As a result, defining the uncovered topics and presenting them in comprehendible formats often requires a fair amount of (manual) labour.
What do we refer to when we refer to the term “topic” in topic models? In LDA, a topic is a multinomial distribution over the terms in the vocabulary of the corpus. Therefore, what LDA gives as the output is not a easily interpretable by humans. Due to that, the raw output of such models is difficult to use as a standalone product or even as output for other models.
How is topic modelling relevant for our CAMERA objectives?
In CAMERA, we used LDA to two extents: first, to filter out research projects irrelevant to the mobility research in Europe and, second, to uncover topics among the retained mobility research projects. In the first case, we started from a large database of research initiatives funded by FP7 and H2020 framework programmes and exploited topic modelling to remove any entries unrelated to the CAMERA analysis, effectively creating CAMERA’s dataset. In the second, we uncovered hidden topics for interpretation in order to develop a standalone product for further data mining processes and mobility reports. While that is the main goal of CAMERA as a coordination, the output of topic modelling will come in handy in other predictive models currently being trained.
However, as already mentioned, those model outputs are difficult to use as is. How can we then easily interpret them and convert them into something that can be useful and presentable in mobility reports for interested decision-makers?
Visualising topic models’ output
Due to the complexity of the output acquired from LDA, the interpretation of the uncovered topics would be extremely difficult if not for interactive visualisations.
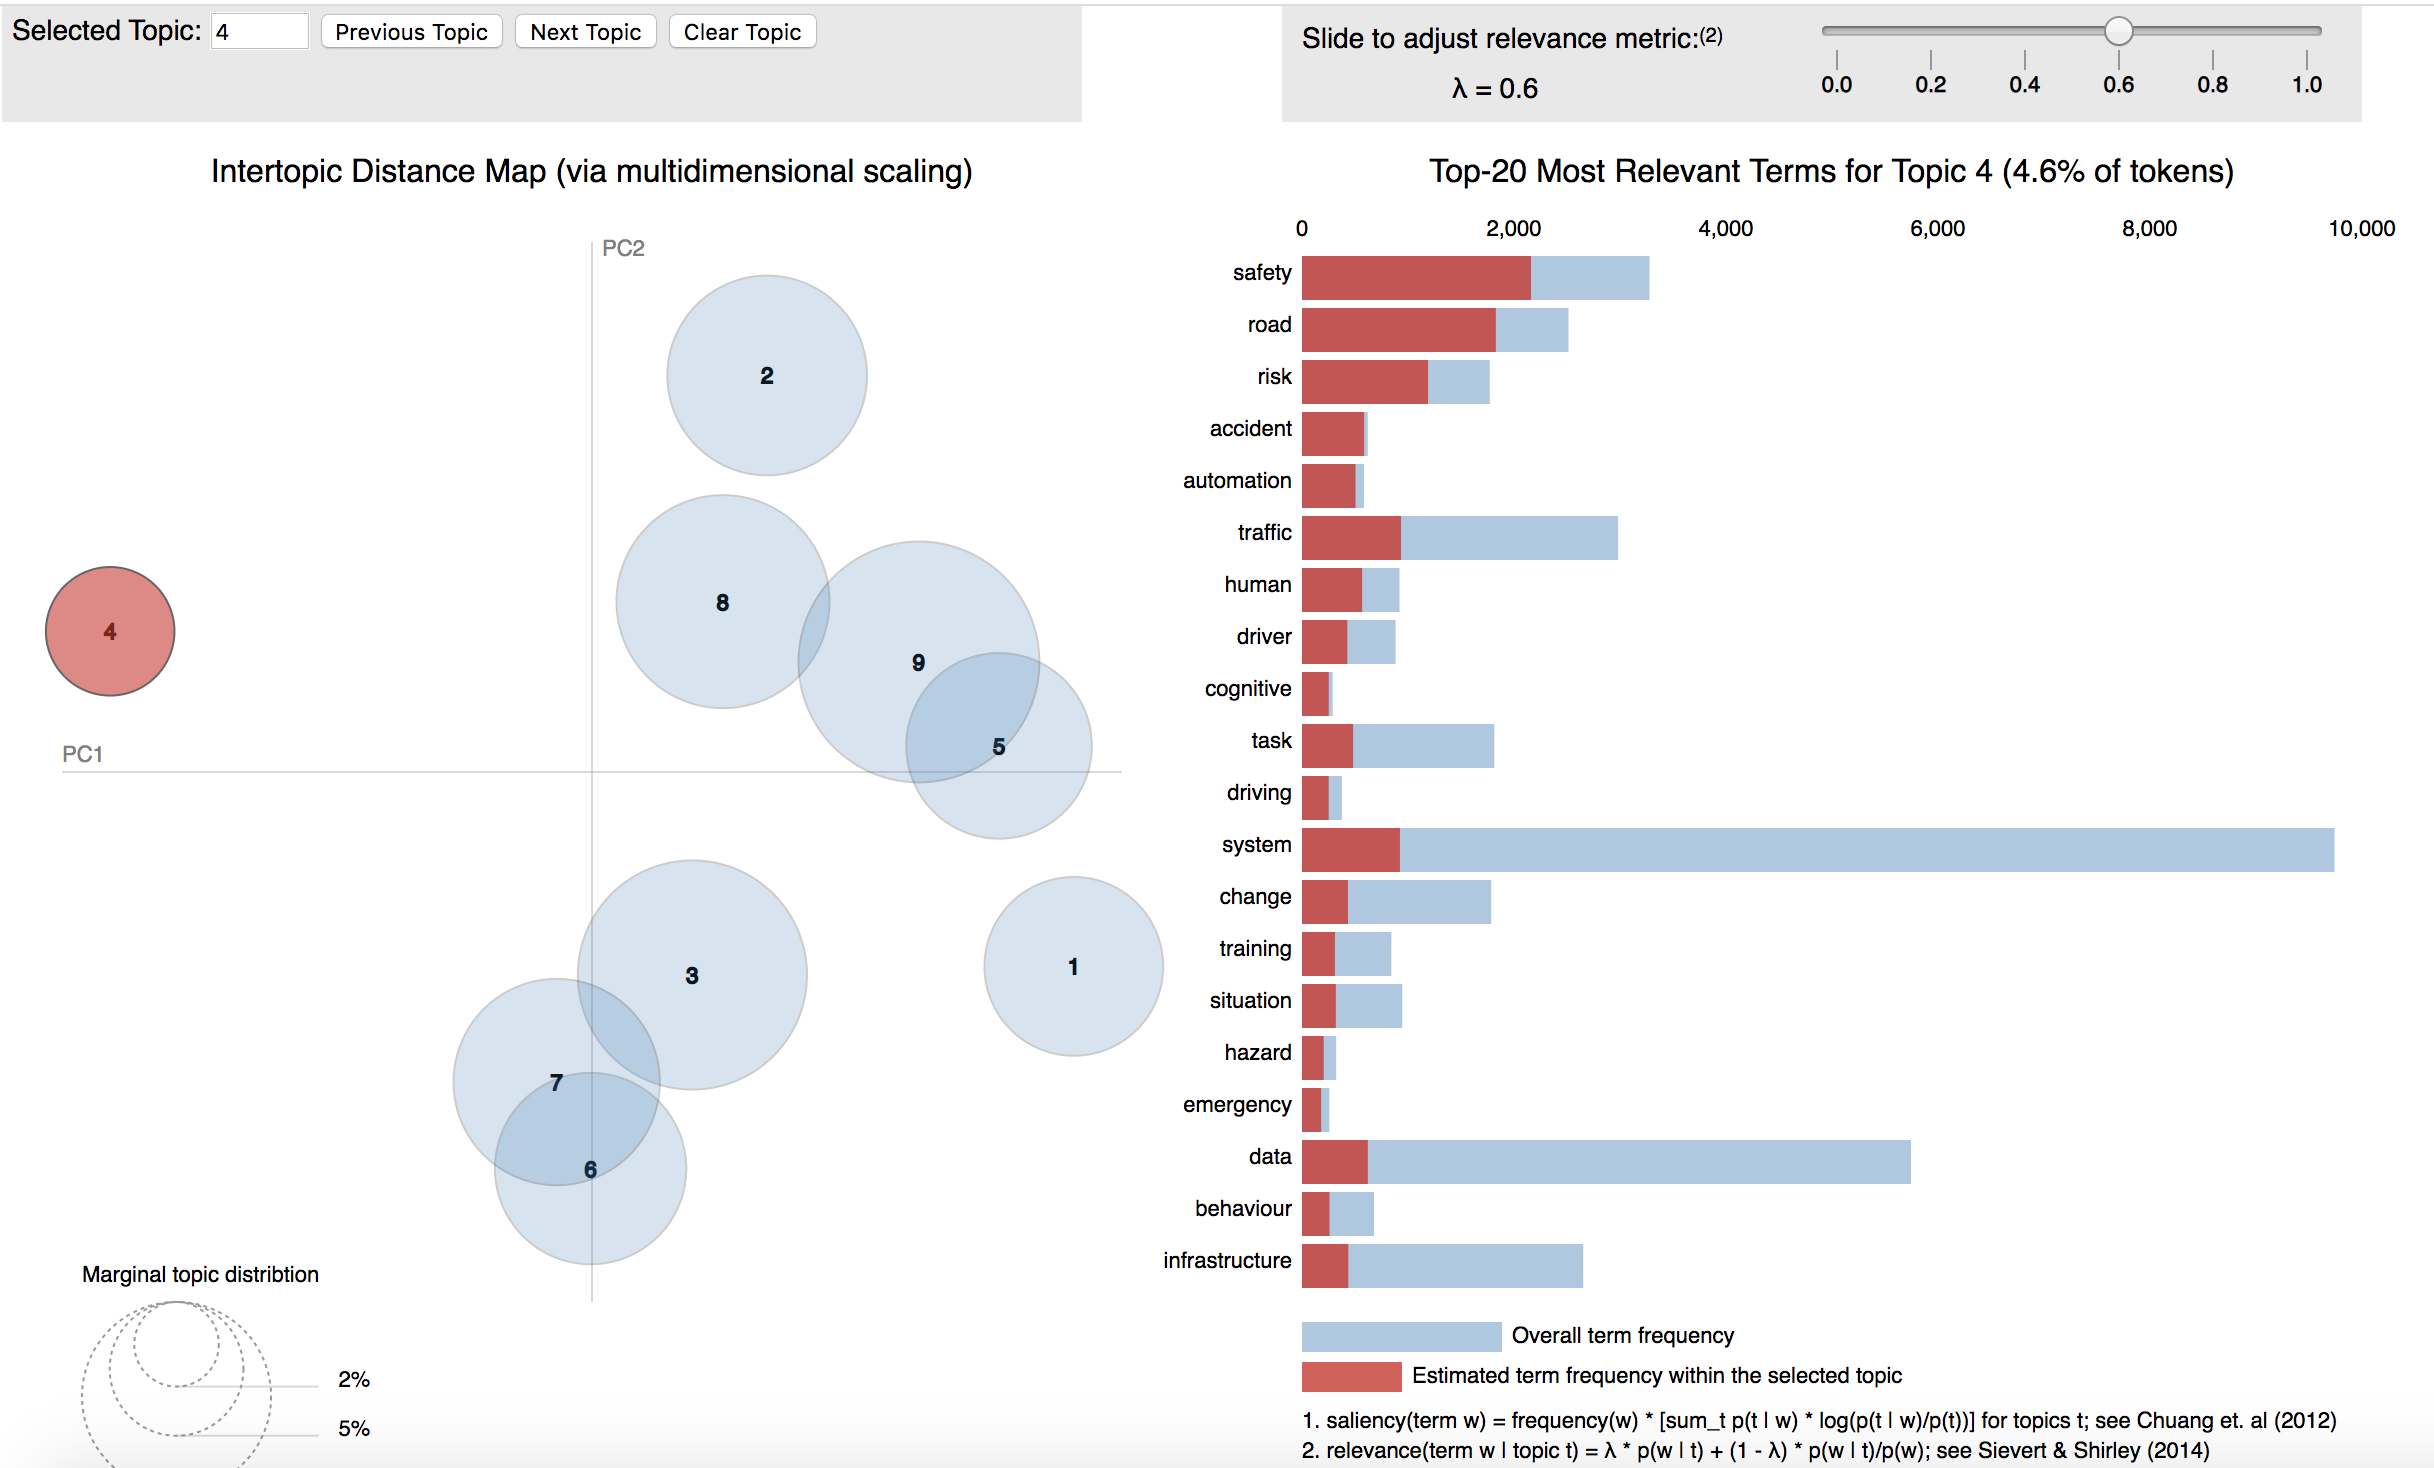
For CAMERA, we turned to the visualisation package LDAvis, presented in detail here, which provides an interactive way of visualising the results of an LDA model. The visualisation provided by LDAvis, shown in Figure 1 below (static here though interactive in the visualisations given by LDAvis), is composed of two main parts: a global map of the topic model on the left and the horizontal bar charts with most relevant terms for each topic on the right.
While most topic visualisations focus on most probable terms specific to each topic, LDAvis is unique in offering its new metric of relevance. Relevance ranks the terms within a topic, taking into account not only a term’s probability within a specific topic but also its probability across the whole corpus. In fact, the authors showed that just looking at the probability of topic-specific terms when trying to interpret a topic is suboptimal. The metric of relevance combines the two aforementioned metrics via a unique parameter of λλ, which determines how much each of the two parts will contribute to the metric.
On figure 1, the selected topic is 4 (red circle on the left hand side), λλ is set to 0.6 and, on the right side, the 20 most relevant terms for the topic 4, under these fixed parameters, are shown. The red horizontal bars give us the the probabilities of the terms for a specific topic, while the ratio between the red and blue bars illustrates how specific a particular term is to a particular topic versus all other topics. Looking at the topic 4, while the term “safety” is the most relevant term for this topic, it is also more common than, for example, the terms “accident” and “automation”, which are relatively rare in the whole corpus, with most occurrences pertaining to this topic. This indicates that the topic 4 identifies research performed in the area of automatic intelligent vehicles.
Relying on this kind of analysis, we were able to interpret the mobility research topics uncovered in CAMERA much more easily.


